Tableau Dashboard Project
Project Information
- Category: Data Analytics
- Project Type: Tableau Dashboard
- Domain: Sales and Performance Analysis
- Tools Used: Tableau, Data Visualization, Dashboard Design
- Focus Area: Business Insight and Visual Reporting
Project Overview
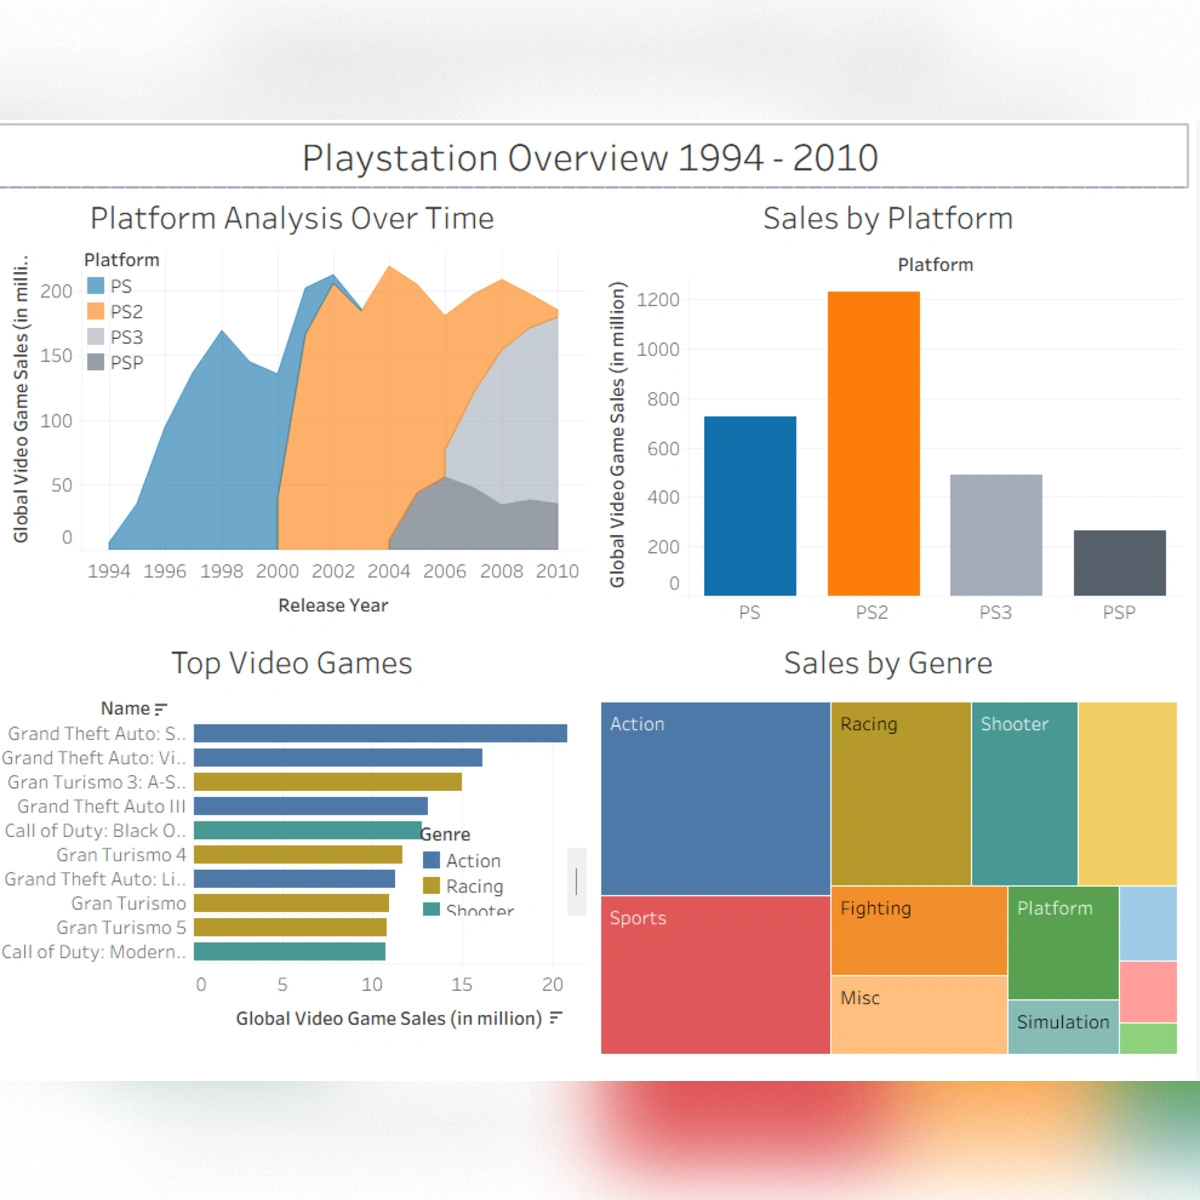
This Tableau project presents a visual analytics dashboard designed to explore sales performance, product category contribution, customer behavior, and regional business trends. The dashboard transforms raw business data into clear and interactive visual insights so that important patterns can be understood quickly.
The project includes multiple Tableau visualizations such as trend charts, category comparison, profit analysis, regional distribution, and segment based summaries. It supports data driven decision making by helping users identify high performing areas, weak business zones, sales variation, and product level contribution.
Tableau
Interactive Dashboard Tool
Visual
Sales and Profit Analysis
Insight
Business Decision Support
Dashboard Highlights
Sales Performance Analysis
Presented sales trends and business performance patterns through clear Tableau based charts and visual summaries.
Category Wise Comparison
Compared product categories and subcategories to identify major contributors to sales and business performance.
Regional Insight
Used regional visualization to observe location based sales variation and identify strong and weak market areas.
Interactive Filtering
Added dashboard level interaction so users can explore data by category, region, year, and business segment.
Key Insights
Skills Demonstrated
Tableau Dashboard Design
Designed an interactive dashboard with clean layout, visual hierarchy, filters, and business focused presentation.
Data Visualization
Created meaningful charts to convert raw numbers into understandable business insights and performance summaries.
Interactive Filters
Used dynamic filters and dashboard actions to allow users to explore the data from different business angles.
Business Intelligence
Converted analytical output into practical decision support for sales, product, region, and performance review.
Data Storytelling
Organized charts and insights in a logical flow so the dashboard communicates a clear business story.
KPI Reporting
Highlighted important performance indicators to help users review business status quickly and effectively.